
Table Of Contents
Overview
What is Project Level Reporting?:
Project Level Reporting turns the flags, camera notes, forms, and chats on one or more projects into a single, finished PDF report you can download or email straight from the OnStation Portal
Who this is for?:
Project managers, inspectors, and admins who put together reports for closeout, DOT submissions, owner updates, or daily status.
What you need:
- Access to the OnStation Portal and a Data License, plus membership in a user group with the Administrator or Data Manager role
- Project Level Reports enabled for your organization (see below)
Not sure if you have these rights? Ask your organization’s admin or User Manager. If you are needing help getting Project Level Reports enabled for your organization, contact your Sales / Success team rep or you can call or text us at (216) 503-8554, or reach out online to submit a ticket.
Project Level Report or Data Export?
Both pull your project data out of OnStation. Pick the one that fits the job.
| Use this | When you need |
|---|---|
| Project Level Report | A high level, finished PDF report: one or more projects, a cover page, project summaries, and flag details with photos, forms, and chat |
| Data export (PDF, CSV, KML, GeoJSON) | Raw data from one project to sort, analyze, or bring into another system. To see more on bulk exporting see the article: Linked Here |
The simple way to choose: if someone is going to read it, use a Project Level Report; if someone is going to work with the data, use a data export. A Project Level Report is built to hand to an owner, inspector, or agency as-is. A data export gives you the raw records to sort in a spreadsheet, map in GIS, or load into another system.
Step 1: Start a new Project Level Report
For one or more projects (up to 10):
- In the Portal, go to Projects.
- Check the box next to each project you want in the report.
- Click Generate Report. The button shows how many projects you’ve selected.
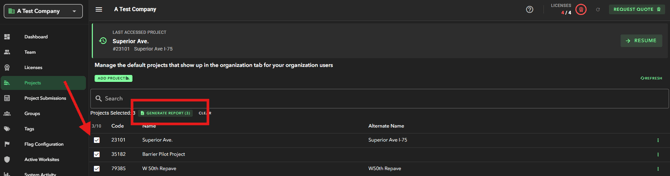
You can change your project list once the report window is open.
From the Project View:
- Open the project in the Portal.
- Click Generate Project Report next to the filters.
After genertaing the report edit the projects included. Use + Add a project to add one, or click the × on a project to remove it.
Step 2: Set your filters
The report window opens on Filters. Everything you set here decides which flags make it into the report.
- Date range: Pick a quick option (Last 1 Day, Last 5 Days, Last 7 Days, Last 30 Days, or Project Lifetime) or enter a Start and End date.
- Shared flags: By default, the report only includes your org’s flags. Turn on Include flags shared with my org to add flags other organizations shared with your org or its members.
- Narrow it down (optional): Use context associated to your organization and filter by- Created or Updated By, Tags, Work Items, Status, or Flag Types.
- Click Check Results to see how many flags and photos match, including a count for each project.
- Click Next.
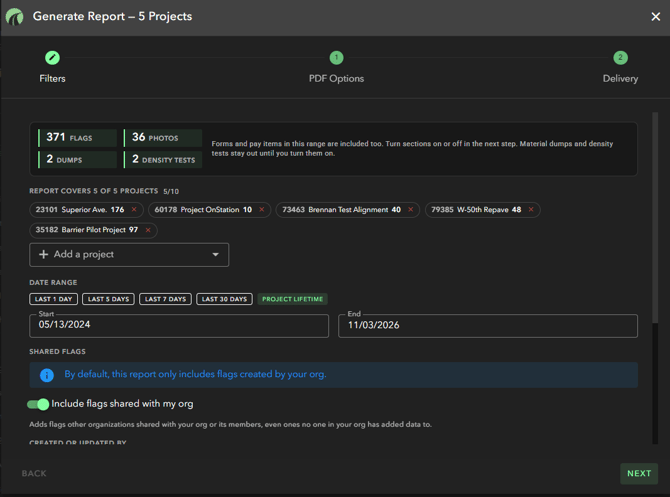
If you change a filter after checking, click Check Results again so your counts stay accurate. Forms and pay items in your date range are included too. You choose which sections appear in the next step.
Step 3: Choose what goes in the PDF
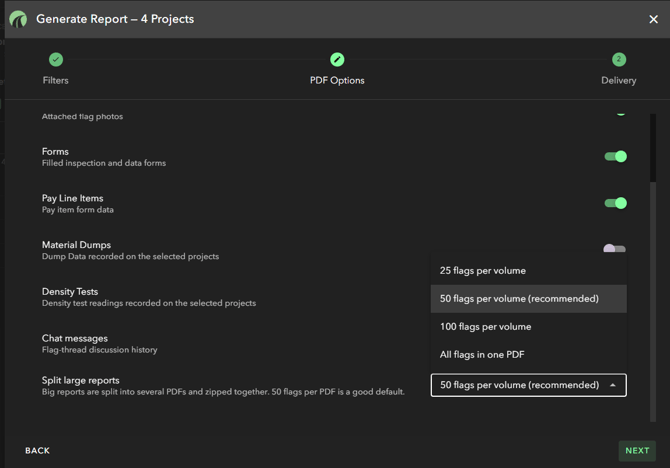
On PDF Options, turn sections on or off so the report only shows what your reader needs.
| Section | What it adds | Default |
|---|---|---|
| Photos | Photos attached to flags | On |
| Forms | Completed inspection and data forms | On |
| Pay Line Items | Pay item form data | On |
| Material Dumps | Dump data recorded on the selected projects | Off |
| Density Tests | Density test readings recorded on the selected projects | Off |
| Chat messages | The chat history on each flag | On |
Split large reports: Big reports are split into several PDFs and zipped together. 50 flags per PDF is the recommended setting. Choose a smaller number if you want smaller files.
Click Next.
Step 4: Download or email it
The Delivery step shows what you’ll get: total flags and photos, and how the zip will be split.
- Report title (optional): Used as the report title and the file name. Leave it blank to use the default.
- Notes (optional): Add context for your reader, up to 2,000 characters. Notes appear on their own page near the front of the report.
- Choose how to deliver it:
- Download: Click Generate Report. You can wait in the window for the download, or close it and pick up the report from your notifications when it’s ready.
- Email: Add a subject, then type email addresses or click Add / Manage Recipients to pick from Recent, Project Users, My Groups, or Org Groups. Click Generate Report. Recipients get a link to the report.
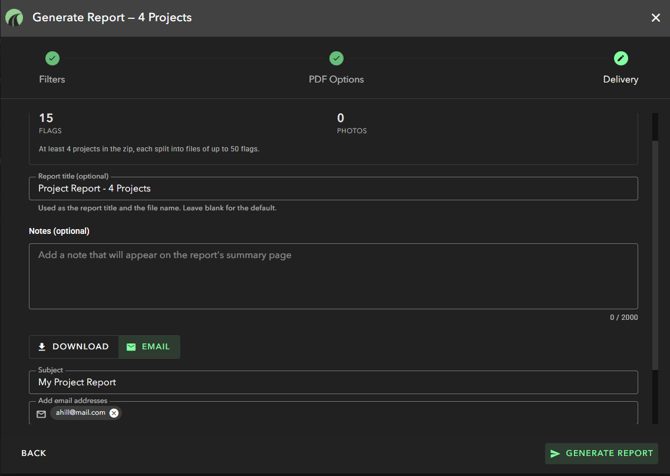 Send the report straight to your team or a group.
Download links expire after 6 hours. If a link has expired, generate the report again.
What’s in the report
Your report arrives as one zip file:
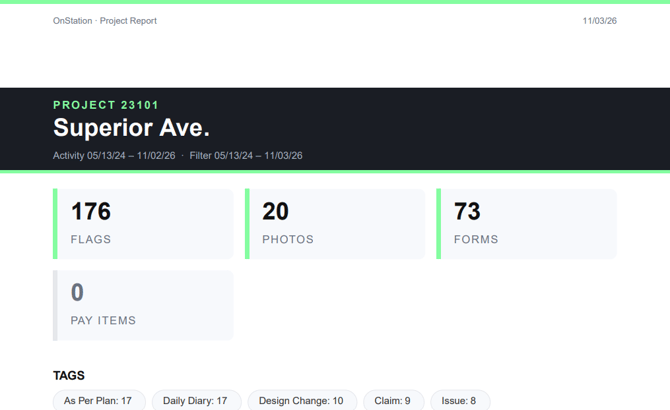
- 00 Project Report Summary.pdf: Start here. It has the cover page, your notes, a summary for each project, and a flag index.
- One folder or PDF per project: Numbered in the same order as the summary (for example, “01 - 12345 - Main Street Reconstruction”). Large projects are split into parts, like “Part 1 of 2.”
The summary includes:
- Cover page: Who ran the report, when, the timezone, and every filter applied.
- Project summary: Activity dates and counts of flags, photos, forms, and pay items for each project.
- Tag and work item breakdowns: A quick view of what’s been happening on each project.
- Flag index: Every flag in the report and which file it’s in.
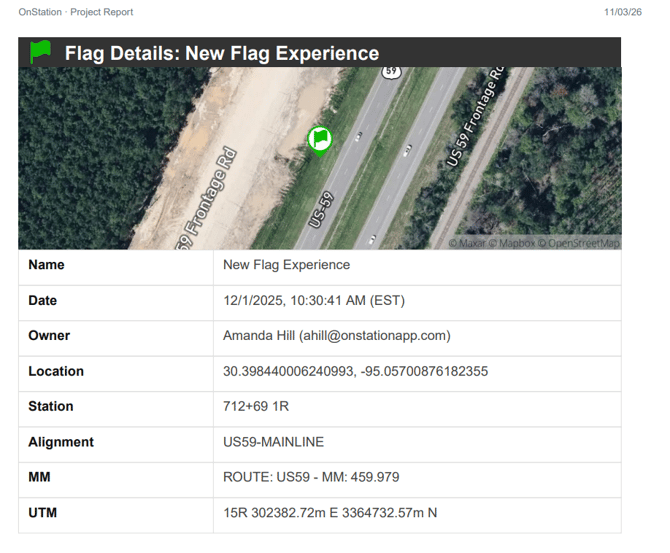
Each project PDF includes a map snapshot and the details for each flag (name, date, owner, location, station, alignment, tags, and notes), followed by any sections you turned on, like photos, forms, and chat.
What’s included from shared flags
When you include shared flags, some information travels with the flag and some stays with the organization that captured it.
| Travels with a shared flag | Stays with the organization that captured it |
|---|---|
| Flag details, notes, chats, photos, and location | Forms. Your report includes forms your org completed, not forms another org completed. |
Troubleshooting & FAQs
I don’t see Generate Report.
Project Level Reporting requires a Data license and Data management permissions. Additionally, Project Level Reporting may not be turned on for your organization yet. Submit a Support Ticket or Call or text us at (216) 503-8554 and we’ll check.
Flags from another organization are missing.
Turn on Include flags shared with my org in the Filters step, then click Check Results again.
Material dump and/or Density test data isn’t in the report.
These sections are off by default. Turn them on in PDF Options.
Material Dump and/or Density Test data STILL isn’t in the report after enabling PDF Option. OR you are not even seeing an option for Material Dump and/or Density Tests.
For Data to be present in these sections one must have the following:
- User generating the report must be in a user group that grants "Location Data Reader" access.
- The Organization must be licensed for FleetWatcher Integration for the Material Dump section to be active. Additionally that project must be configured for the integration.
- To see more on FleetWatcher Integration see article: Linked Here
- To see more on FleetWatcher Integration see article: Linked Here
- The Organization must be licensed for TransTech Integration for the Density Test section to be active.
- To see more on TransTech Integration see article: Linked Here
Have additional questions on either integration? Submit a Support Ticket or Call or text us at (216) 503-8554 and we’ll check.
Generate Report is grayed out when emailing.
Add at least one recipient.
My download link doesn’t work.
Links expire after 6 hours. Generate the report again.
Need more help? Call or text us at (216) 503-8554, or reach out online.
Video Demo